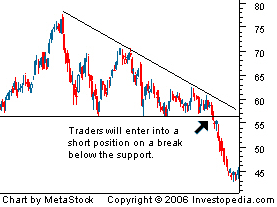
Bored with GJ move today, I eye-balled EU chart and noticed the pair is making a series of lower highs and developing a bearish descending triangle pattern on the H4 chart.
Should the price breaks the support at 1.3740, this might signify a 600 pips downwards to 1.31xx. Let see latter whether this pattern holds or not.
Below is the H4 chart as of 5 pm Malaysia.
Should the price breaks the support at 1.3740, this might signify a 600 pips downwards to 1.31xx. Let see latter whether this pattern holds or not.
Below is the H4 chart as of 5 pm Malaysia.


0 comments:
Post a Comment
You are welcome to post comments. However, please do not use Anonymous as your ID. At least, put in your initials for easy reference in further conversations.