
Impact of U.S Interest Rate Hike
10 years ago
downwards today???Monday, September 20, 2010
A self explanatory chart
 Correction: the candlestick on the daily chart is a bearish shooting star; not a hanging man as mentioned on the chart above UPDATE: 7 hours later  Japan Can't Curb Yen's Gains by Acting Alone, Bank of Korea Governor SaysSunday, September 19, 2010Japan can’t resolve the difficulty of the strong yen unilaterally as currency-market intervention by a single country has limited effect, Bank of Korea Governor Kim Choong Soo said.Read more here. confluence of two trend lines and 135 round numberSaturday, September 18, 2010
The upsurge due to the BOJ intervention is now stalled at the confluence of two crucial trendlines and 135 round number. Unless price breaks upwards, the major downtrend is still intact.
As the first attempt will usually fails, there is a possibility that the price will retrace downwards to re-test the broken resistance which now should turns into support at 132.00 area. Only then, we could see whether the BOJ is still insisting on the intervention or not.....  BOJ interventionWednesday, September 15, 2010
Just for record....
Source: Bloomberg The yen fell after Japan intervened to weaken its currency for the first time since 2004.  uncertainty....Saturday, September 11, 2010
The beast is now moving without a direction between 130.30 and 128.77. As long as the price is entrapped within the range, it is better to stay aside and wait until the price breaks out of the range.
On the other hand, a possible descending triangle is in play on the H4 chart. Even though it is not a textbook pattern; since the current trend is downwards, I am favor of a further southwards journey for the beast unless 130.30 is taken. Good luck and happy trading..... "Always Assume The Underlying Trend To Continue Unless Proven Otherwise.."  Swing tradeTuesday, August 31, 2010
Price has made a pullback to test the broken trendline and was rejected by the fib 50% levelof the previous downswing. As long as the broken trendline holds, there is a possibility that price will continue downwards to 123.40 region.
Stop loss is placed at 138.00 in case the set up fails.  will the lower trendline holds???Sunday, August 22, 2010
The price has failed to close below the daily lower trendline and now has formed a variance of a bullish dragonfly doji - an indication that a temporary low might be forming.
As long as the lower trendline holds, the price might retrace to test the upper trendline in the 135-136 region. Below is the daily chart as of weekend closing.  Pullback tradingThursday, August 19, 2010
Price has broken the upper trendline on the H1 chart and later pulled back to re-test the trendline. Now it looks like the broken trendline has become a resistance and the price should move upwards now.
I placed a buy position at the close of the H1 candle with stop loss placed slightly below the swing low. Let's see how it goes....  buy again???Thursday, May 20, 2010Once again the price was rejected by the crucial support at 130.00 and formed another bullish. The descending trendline on the hourly chart looks to have been breached. Therefore I placed a buy stop above yesterday's high with the profit taking target is not determined yet. Yesterday's low will be the place to cut loss should the price keeps going down.  testing the support again...Wednesday, May 19, 2010The price is now testing the support zone again at 132.20 area. I will leave my buy position open and the price trigger the stop loss if the bears are still want to pull the market.down. Any loss should be off set by the gain on my sell position from 138.20. Will come back tomorrow to see what is the market's decision.  Bullish hammer???Tuesday, May 18, 2010A bullish hammer on the daily chart indicates that a retracement is due and the price could goes upwards for the coming few days. I have closed 3/4 of my sell positions and leave the remaining lots open. On the other hand, a buy entry is placed at the daily candle's close with stop loss placed below the candle's low. This is a "set and forget" entry as I will only look at the chart again after 24 hours.  extremely busy....Sunday, May 16, 2010Sorry friends, I was really busy in the past couple of weeks. I have been appointed as an introducing broker for IntelFX and have to spend time in some discussions and promotion activities. I had to switched to daily timeframe trading and a dragonfly candlestick followed by a bearish spinning prompted me to sell a couple of positions last Wednesday. Stop loss was originally placed slightly above the previous swing high and now both positions are in gain.  friday's low broken???Monday, May 3, 2010The hourly candle has now closed below the Friday's low after retracing to 38.2% fib level. As long the beast stays below 144.20, there is a possibility that 142.00 will be hit soon. Below is the hourly chart as of 10 am Malaysia.  141.7x soon???Thursday, April 22, 2010The price is now already penetrated the minor support at 143.00 and looks the bears are gaining momentum to pull the beast downwards. The next support to be tested is yesterday's low at 142.66; once this support is broken, the price should accelerates to 141.7x. Let's see whether the market agrees or not. Below is the 30min chart as of 9.30 am.  lower high???Wednesday, April 21, 2010After gapping down 120 pip last Monday, the bulls launched a counter attack when the price hit the major daily trendline and pushed the price up to 143.5x. Even though a lower high appears to be forming on the H4 chart, it is too early to determine the real direction as the price is still in sideway mode.Thus, trade with care and keep the stops tight. Below is the H4 chart as of 9 am Malaysia.  rel="lightbox" title="http://www.gjtrader.co.cc/" double trouble for the bulls???Saturday, April 17, 2010A confirmed hanging man and an abandoned baby candlestick formations has developed on the weekly and daily charts respectively - a rare occasion where both the weekly and daily timeframes are in tandem to show that the bulls are currently in a double trouble situation. In my humble opinion, there is a high probability that the the 140.90 minor support could easily be broken and the price could drop further to test the next support level at 138.20 area. Let's see what the market has in store for us next week.  possible exhaustion gap???Tuesday, April 13, 2010This week the price gapped up but failed to sustain the momentum and later, the day closed within the opening gap; implying that the bulls might have exhausted and losing their steam. A shooting star candlestick also has formed; indicating that the market sentiment has turned bearish - at least for the time being. A possible double top formation is now in play but bears still need to break the minor support at 140.9x to have the upper hand over the bulls. However the battle is not yet won unless the lower major trendline is broken. Below is the daily chart as of 5 am Malaysia.   hanging man on weekly chart???Saturday, April 10, 2010A bearish hanging man candlestick has formed on the weekly chart; providing a slight clue that the bears are still trying to gain ground on the market. However a bearish candle on the daily is needed to CONFIRM that the bears are gaining momentum to wrest the battlefield from the bulls. The chart below outlines my trading plan for next week. A price close above 144.5x will invalidate the plan.  Update (5 days later):  bears, watch out 139 level...Thursday, April 8, 2010So far, the beast is on track with it's southwards journey. However, the the bears need to be careful and watch 139 level closely. Below H4 chart shows that 139 is a crucial level and might dictate a possible major trend reversal should the price fails to pierce through it. Meanwhile it is best to wait for confirmation before jumping into a trade.  Update:  evening star formation???Wednesday, April 7, 2010A variance of evening star formation has appeared on the daily chart - usually a reliable confirmation that the price should continue the southwards journey. Possible target projections are placed at 140.9x and 139.6x which are the 38.2% and 50% retracement level of previous upwards swing. Below is the daily chart as of 5 am Malaysia.  Update:  H4 outlookTuesday, April 6, 2010After such a sharp upwards move, it seems now that the bulls are losing their momentum and should start a downwards correction phase. A 38.2% retracement will bring the price down to 140.9x and I wouldn't be surprised if the beast decides to go down all way to 138.4x which coincides with the GBPJPY's favorite 61.8% retracement level within next few days. Below is the H4 chart as of 1 pm Malaysia.  Update:  map to the future???Saturday, April 3, 2010The price is now managed to close slightly above the major trendline on the daily chart. However the breakout is not decisive yet and more confirmation is needed to determine next direction. In my humble opinion, even if the trend has changed, the price still needs to go down to 138.xx level and only then we could see whether the bulls are still insistent or not.  Update (as 17 April):  bears' last defense.....Friday, April 2, 2010Now the price has shot up and reached the bears last defense at 143.60, where there is a confluence of the major descending trendline and clusters of crucial SnR level. However, thin trading volume is expected tomorrow as the European banks will be on holiday and the price action could be erratic until the NFP data release tomorrow night. Until then, good luck and happy trading. Below is the daily chart showing the crucial trendline and SnR level to be watched.  where are all the bears???Thursday, April 1, 2010The bulls are really having their fun this week with the bears are still nowhere in sight. After looking around, at last, I found the bears and joined them.....   A or B???Saturday, March 27, 2010Friday price action went insane as the beast was unpredictable and it defied the logic of my technical approach. Decide to stay out and take a break until a bearish candle comes out on the daily chart. Meanwhile let's see which path this beast will take next week. Below is the daily bar chart showing the critical SnR levels.  credit to bro JVG100 the bulls exhausted???Friday, March 26, 2010The crazy yen depreciation for the last two days forced the bears to retreat and watch the rally from the sidelines. However, the bulls advance is now stalled by the confluence of two trendlines and the fib 50% level of last major swing. Now the bears might come in and pull the beast down to test the next lower trendline at 135.50 region. Below is the H4 chart as of 5 am Malaysia.  a breakout is imminent....Wednesday, March 24, 2010Usually when the price keeps on coiling until the end of the converging trendlines, a breakout is imminent and a big move could be expected. Just be patient and trade in the direction of the breakout. A tight stop loss should be placed just slightly above or below the opposite trendline. Let's see which direction that the beast will take. Below is the hourly chart as of 11 am Malaysia.  wandering aimlessly.....Tuesday, March 23, 2010The price is now consolidating within the two lower trendlines on the H4 chart. The bulls are trying to push the price upwards but it was rejected by the fib 61.8% level of the previous significant swing. The beast will keep on wandering aimlessly within the two trendlines and the next direction could only be ascertained when the price breaks out of either trendline. It is advisable to stay out and wait before jumping into a trade. UK CPI data release which is coming out within a few minutes might provide more clues on the beast direction. Below is the H4 chart as of 5 pm Malaysia.  will the history repeats itself???Saturday, March 20, 2010One of the premises on which the technical approach is based on is "history repeats itself". Below is an excerpt from John J. Murphy book - Technical Analysis of the Financial Markets.  Meanwhile, a possible bearish flag is developing on the daily chart. Should the price keeps breaking the major lower trendline, the height of the bearish pole indicates a possibility of a 1,000 pips downwards move. Below is the daily chart as of the market closing today.
 today's set upFriday, March 19, 2010A bearish candle on the daily chart favors a further downwards move today. A price penetration below 137.50 is needed for a confirmation that the bears will come out and try to gain the upper hand over the bulls. Once the price closed below 137.50, it might go down to test the the H4 lower trendline at 136 area. Meanwhile, previous the swing high at 138.40 should now turned to a minor resistance level. Below is the hourly chart as of 10.40 am Malaysia.  Update: 19 hours later, just before the market closed....  will the role reversal play out???Wednesday, March 17, 2010Excerpt from http://www.incrediblecharts.com/ Support levels, once penetrated, frequently become resistance levels and vice versa. The market logic is fairly simple: buyers who purchase near a support level, only to see price fall, are likely to sell in order to recover their losses, when price rallies to near their break-even point. The support level then becomes a resistance level.  I will now sit tight and watch closely the price action along the previous resistance cluster. Take note that the price is coiling within the two converging trendlines and a possible bearish pennant pattern might be in play; even though the range is too huge to my liking. As long as the price stays below 140 zone, I will still holding my bearish sentiment. Below is the GBP/JPY daily chart.  trendline rejection???Tuesday, March 16, 2010The price is now has been rejected by the descending trendline on the daily chart; an indication that the major downtrend is still in play. It would be interesting to watch how the market reacts once the price approaches the 135.0 level today; which is a significant round number. A penetration below 135.0 will further spurs more sellers to pull the price to test the previous low at 133.8x. Meanwhile, a bounce from 135.0 could be a sign that the current rally is not done yet. Below are the daily and H4 charts as of 5 am Malaysia.   2nd H4 chart added with another ascending trendline added  will it bounce or break???Sunday, March 14, 2010The price is now approaching a confluence of a descending trendline and the last broken support at 138.20; which is at the proximity of 50% and 61.8% fib level. A bounce form this level is needed to ensure the bears are very much alive. On the other hand, dull and directionless trading sessions could be expected on Monday and Tuesday as the market is waiting for FOMC data release on Wednesday. Below is the daily chart as of this weekend.  potential downwards move???Friday, March 12, 2010A variance of gravestone doji candlestick has appeared on the H4 chart, which might signify that the rally could not be sustained for the time being. Another bearish candlestick is needed for confirmation that the price will go down and re-test the significant round number level at 135.0.
A penetration below 135.0 could be a strong indication that the bears are still determined to gain control of the market. Let's see how the market play it out... Below is the h4 chart of 9 am Malaysia. 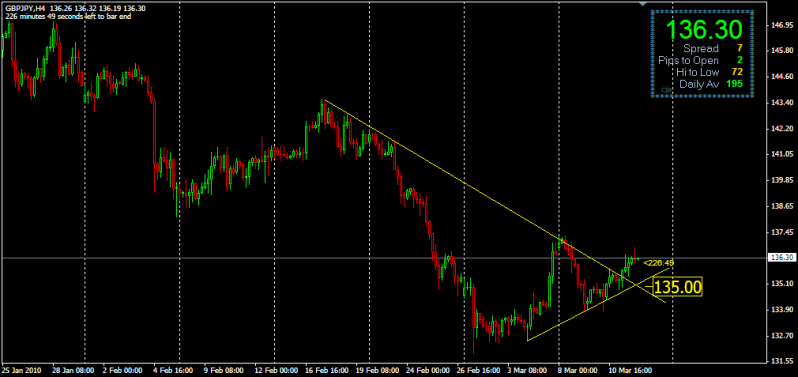 the bermuda triangle....Thursday, March 11, 2010The beast is now entrapped between the two converging trendlines; indicating that both the bulls and bear camps are struggling to defend their territory. Even though currently the bulls are having the upper hand, it is advisable not to trade as long as the price is coiling within the triangle. Should the descending trendline is taken, it is possible that the price will test 137.xx area again. As usual, I will stay out if the price rallies upwards again and wait for bulls exhaustion confirmation before considering any new entry; especially now when I have a few bad entries... impatient me... LOL Below is the H4 chart as of 6 am Malaysia. 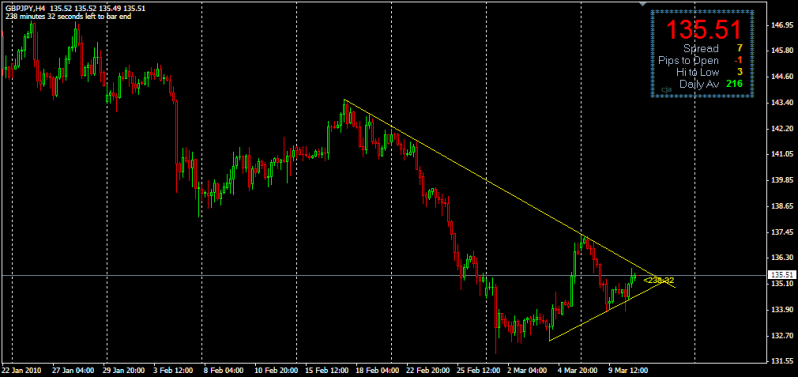 retracement completed???Wednesday, March 10, 2010The price has now retraced 38.2% to 135.2x and a bearish candle on the hourly chart implies that the bullish retracement might have been completed. As long as the candle's high (135.16) is not breached, the beast might continue going down and re-test yesterday's low at 133.8x. Should the bears keep on persisting, it is possible that the price might continue downwards to 131.7x which is the 161.8% fib level. Below is the hourly chart as of 9 am Malaysia. 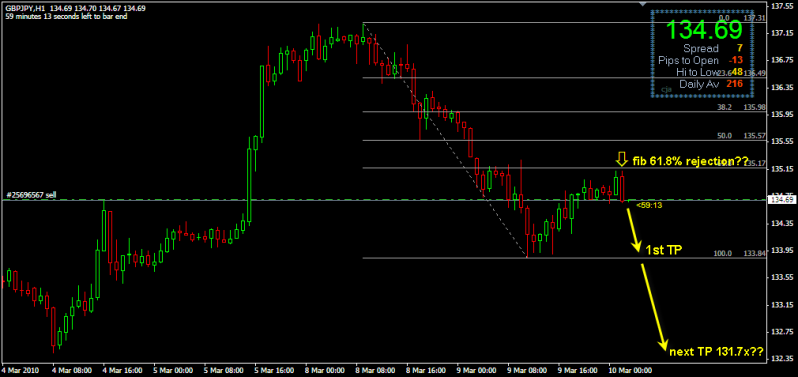 134.7x is the key level now...Tuesday, March 9, 2010A bearish harami candle on the daily chart and the price rejection by the descending trendline on the H4 chart could be the early indication that the recent bullish rally might have been completed and the current major downward trend is still remains intact.
An aggressive seller might has already entered the market with a stop-loss placed slightly above the swing high at 137.3x with 1st profit target placed at the minor support at 134.7x. Meanwhile a more conservative seller might want to wait until the minor support at 134.73 is decisively penetrated, before boarding the Southern Express train to the previous low at 132.00 region. Below is the H4 chart as of 6 am Malaysia. 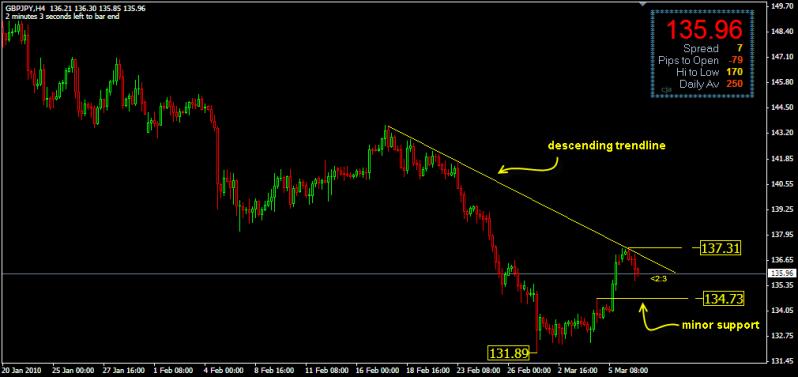
Subscribe to:
Posts (Atom)
|
My Blog List
|
About me | Simple Box Template by Subagya © 2009 | Free Blogger Templates | RSS Feeds
Back to TOP