Impact of U.S Interest Rate Hike
10 years ago
A or B???Saturday, March 27, 2010Friday price action went insane as the beast was unpredictable and it defied the logic of my technical approach. Decide to stay out and take a break until a bearish candle comes out on the daily chart. Meanwhile let's see which path this beast will take next week. Below is the daily bar chart showing the critical SnR levels.  credit to bro JVG100 the bulls exhausted???Friday, March 26, 2010The crazy yen depreciation for the last two days forced the bears to retreat and watch the rally from the sidelines. However, the bulls advance is now stalled by the confluence of two trendlines and the fib 50% level of last major swing. Now the bears might come in and pull the beast down to test the next lower trendline at 135.50 region. Below is the H4 chart as of 5 am Malaysia.  a breakout is imminent....Wednesday, March 24, 2010Usually when the price keeps on coiling until the end of the converging trendlines, a breakout is imminent and a big move could be expected. Just be patient and trade in the direction of the breakout. A tight stop loss should be placed just slightly above or below the opposite trendline. Let's see which direction that the beast will take. Below is the hourly chart as of 11 am Malaysia.  wandering aimlessly.....Tuesday, March 23, 2010The price is now consolidating within the two lower trendlines on the H4 chart. The bulls are trying to push the price upwards but it was rejected by the fib 61.8% level of the previous significant swing. The beast will keep on wandering aimlessly within the two trendlines and the next direction could only be ascertained when the price breaks out of either trendline. It is advisable to stay out and wait before jumping into a trade. UK CPI data release which is coming out within a few minutes might provide more clues on the beast direction. Below is the H4 chart as of 5 pm Malaysia.  will the history repeats itself???Saturday, March 20, 2010One of the premises on which the technical approach is based on is "history repeats itself". Below is an excerpt from John J. Murphy book - Technical Analysis of the Financial Markets.  Meanwhile, a possible bearish flag is developing on the daily chart. Should the price keeps breaking the major lower trendline, the height of the bearish pole indicates a possibility of a 1,000 pips downwards move. Below is the daily chart as of the market closing today.
 today's set upFriday, March 19, 2010A bearish candle on the daily chart favors a further downwards move today. A price penetration below 137.50 is needed for a confirmation that the bears will come out and try to gain the upper hand over the bulls. Once the price closed below 137.50, it might go down to test the the H4 lower trendline at 136 area. Meanwhile, previous the swing high at 138.40 should now turned to a minor resistance level. Below is the hourly chart as of 10.40 am Malaysia.  Update: 19 hours later, just before the market closed....  will the role reversal play out???Wednesday, March 17, 2010Excerpt from http://www.incrediblecharts.com/ Support levels, once penetrated, frequently become resistance levels and vice versa. The market logic is fairly simple: buyers who purchase near a support level, only to see price fall, are likely to sell in order to recover their losses, when price rallies to near their break-even point. The support level then becomes a resistance level.  I will now sit tight and watch closely the price action along the previous resistance cluster. Take note that the price is coiling within the two converging trendlines and a possible bearish pennant pattern might be in play; even though the range is too huge to my liking. As long as the price stays below 140 zone, I will still holding my bearish sentiment. Below is the GBP/JPY daily chart.  trendline rejection???Tuesday, March 16, 2010The price is now has been rejected by the descending trendline on the daily chart; an indication that the major downtrend is still in play. It would be interesting to watch how the market reacts once the price approaches the 135.0 level today; which is a significant round number. A penetration below 135.0 will further spurs more sellers to pull the price to test the previous low at 133.8x. Meanwhile, a bounce from 135.0 could be a sign that the current rally is not done yet. Below are the daily and H4 charts as of 5 am Malaysia.   2nd H4 chart added with another ascending trendline added  will it bounce or break???Sunday, March 14, 2010The price is now approaching a confluence of a descending trendline and the last broken support at 138.20; which is at the proximity of 50% and 61.8% fib level. A bounce form this level is needed to ensure the bears are very much alive. On the other hand, dull and directionless trading sessions could be expected on Monday and Tuesday as the market is waiting for FOMC data release on Wednesday. Below is the daily chart as of this weekend.  potential downwards move???Friday, March 12, 2010A variance of gravestone doji candlestick has appeared on the H4 chart, which might signify that the rally could not be sustained for the time being. Another bearish candlestick is needed for confirmation that the price will go down and re-test the significant round number level at 135.0.
A penetration below 135.0 could be a strong indication that the bears are still determined to gain control of the market. Let's see how the market play it out... Below is the h4 chart of 9 am Malaysia. 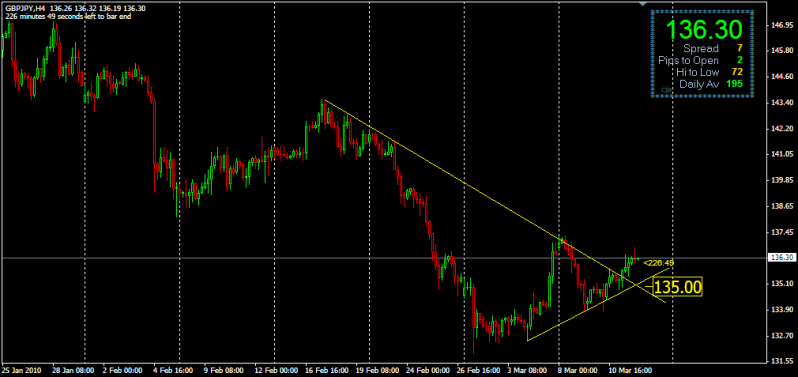 the bermuda triangle....Thursday, March 11, 2010The beast is now entrapped between the two converging trendlines; indicating that both the bulls and bear camps are struggling to defend their territory. Even though currently the bulls are having the upper hand, it is advisable not to trade as long as the price is coiling within the triangle. Should the descending trendline is taken, it is possible that the price will test 137.xx area again. As usual, I will stay out if the price rallies upwards again and wait for bulls exhaustion confirmation before considering any new entry; especially now when I have a few bad entries... impatient me... LOL Below is the H4 chart as of 6 am Malaysia. 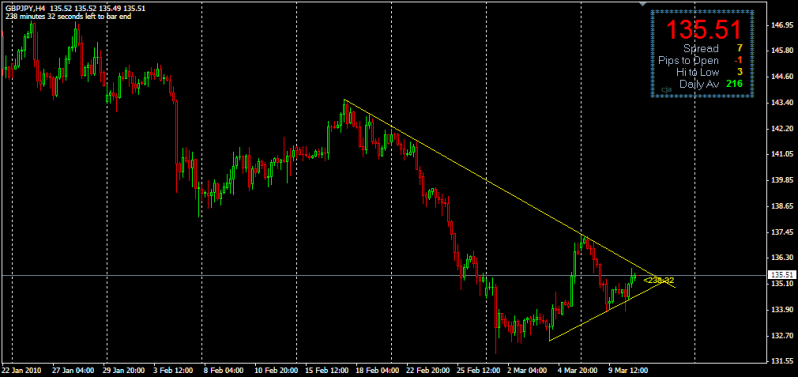 retracement completed???Wednesday, March 10, 2010The price has now retraced 38.2% to 135.2x and a bearish candle on the hourly chart implies that the bullish retracement might have been completed. As long as the candle's high (135.16) is not breached, the beast might continue going down and re-test yesterday's low at 133.8x. Should the bears keep on persisting, it is possible that the price might continue downwards to 131.7x which is the 161.8% fib level. Below is the hourly chart as of 9 am Malaysia. 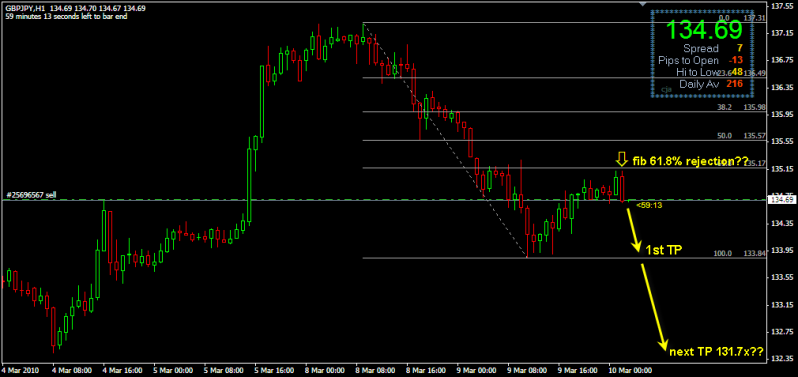 134.7x is the key level now...Tuesday, March 9, 2010A bearish harami candle on the daily chart and the price rejection by the descending trendline on the H4 chart could be the early indication that the recent bullish rally might have been completed and the current major downward trend is still remains intact.
An aggressive seller might has already entered the market with a stop-loss placed slightly above the swing high at 137.3x with 1st profit target placed at the minor support at 134.7x. Meanwhile a more conservative seller might want to wait until the minor support at 134.73 is decisively penetrated, before boarding the Southern Express train to the previous low at 132.00 region. Below is the H4 chart as of 6 am Malaysia. 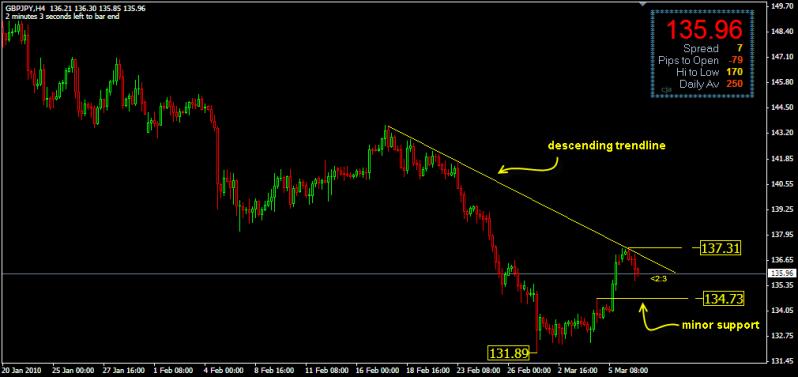 sometime a picture is worth a thousand wordsSunday, March 7, 2010Sometime we miss the forest for the trees by focusing on the smaller timeframes. Zooming out a chart will enable us to pin point the crucial support and resistance levels and see how the role reversal concept plays out perfectly according to the textbook. That is to say, once a support level broken decisively, it reverses it's role and becomes a resistance level and vice-versa. The most recently support or resistance level which has been formed will exert more influence on the next market move. The below BIG picture of the daily chart is worth a thousand words... 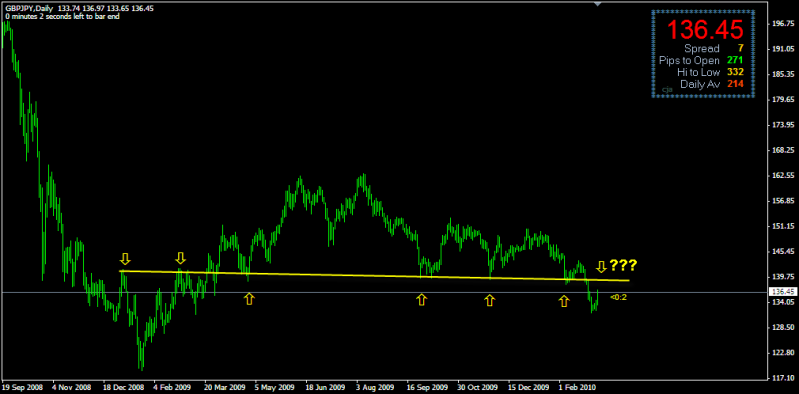 technically, the retracement has not started yet...Friday, March 5, 2010A glance on the H4 chart shows that the price still failed to make a new higher high. As long as the price remains below 135.4x, the current downtrend remains intact. A clean break below 133.50 should signals a further downward move to test the previous low at 131.93. Maybe the coming NFP data tonight will provide more clues on the beast next direction. Until then, happy trading and good luck. Below is the H4 chart as of 6 am Malaysia.  the market is dead...Thursday, March 4, 2010The market is in a cautious mood as the price was almost stagnant the whole day yesterday. Personally I am expecting an retracement but nothing is confirmed yet now. Currently the bull camp does has a slight advantage as a bullish candle has formed on the daily chart. However, no clear direction could be determined yet now as the big banks might be waiting for MPC and NFP data result today and tomorrow respectively. The best position now is NO POSITION. When in doubt, stay out - nobody ever had lost an account by staying out....  will the trend continue???Wednesday, March 3, 2010An insider bar on the daily chart; indicates that market is looking for more clues for next direction and a breakout could occur either way. However, on a closer look, the price is making lower highs on the hourly chart and a variance of descending triangle is currently forming on 15 min and 30 min chart; favoring a downwards breakout. For the time being, it is safer to stay out and wait for the market shows us the way. Below is the hourly chart as of 7 am Malaysia.  will the fib 50% level holds???Tuesday, March 2, 2010After skydiving for 348 pips, the beast retraces upward and now seems to be rejected by the fib 50% level. As long as the price stays below 134.00, there might be a possibility that the bears will come out again to pull the beast down to 132 area again. Should the yesterday low at 132.00 is broken, next destination could be 130.xx. Let see how the market play s it out. Below is the hourly chart as of 9.30 am Malaysia. 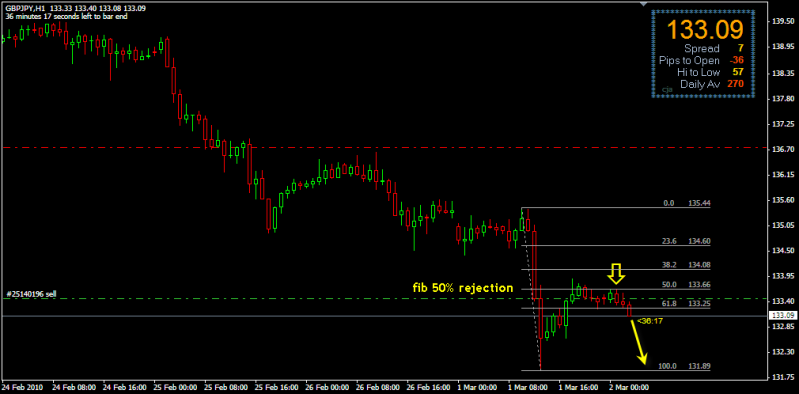
Subscribe to:
Posts (Atom)
|
My Blog List
|
About me | Simple Box Template by Subagya © 2009 | Free Blogger Templates | RSS Feeds
Back to TOP