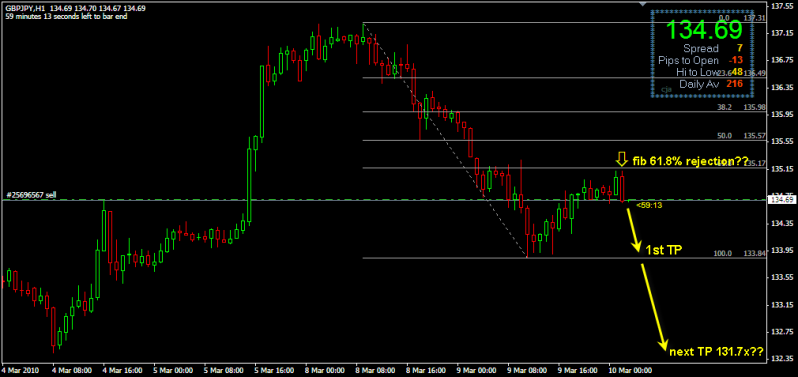
The price has now retraced 38.2% to 135.2x and a bearish candle on the hourly chart implies that the bullish retracement might have been completed.
As long as the candle's high (135.16) is not breached, the beast might continue going down and re-test yesterday's low at 133.8x. Should the bears keep on persisting, it is possible that the price might continue downwards to 131.7x which is the 161.8% fib level.
Below is the hourly chart as of 9 am Malaysia.

0 comments:
Post a Comment
You are welcome to post comments. However, please do not use Anonymous as your ID. At least, put in your initials for easy reference in further conversations.