chart h4 at the market closing...
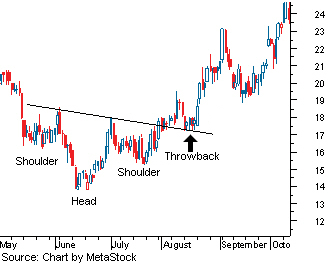
Compare the above chart with the chart below.

I am still holding my sell positions over the weekend as I believe the beast is now making a "throwback" move toward the neckline; which is at the proximity of 135.20.
Investopedia.com defines a throwback move as following:
This situation occurs when the price breaks through the neckline, setting a new high or low (depending on the pattern), followed by a retreat back to the neckline. This move back to the neckline is considered to be a test of the pattern and the newly reversed support or resistance.
Read more about the throwback move here.
0 comments:
Post a Comment
You are welcome to post comments. However, please do not use Anonymous as your ID. At least, put in your initials for easy reference in further conversations.